


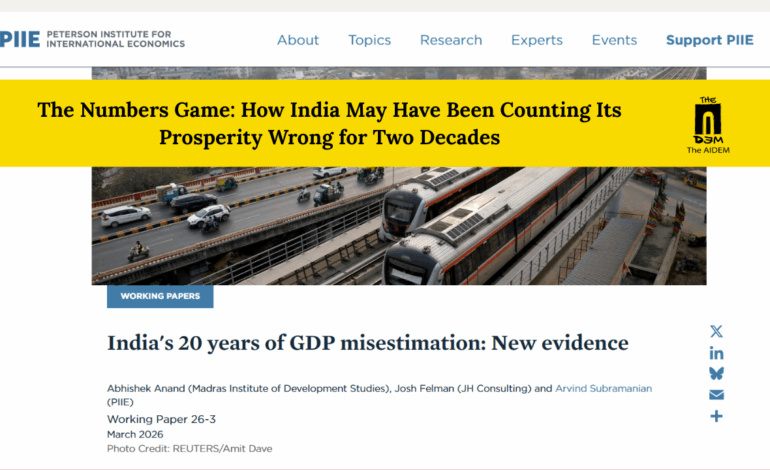
A Peterson Institute working paper rips open a long-suppressed debate: that India’s official growth story was built on a statistical illusion, and millions of lives were quietly excluded from the arithmetic of progress.
The Claim That Shook New Delhi
On March 9, 2026, the Peterson Institute for International Economics published Working Paper 26-3, a document whose title alone was “India’s 20 Years of GDP Misestimation: New Evidence.” Its authors were Abhishek Anand, a Visiting Fellow at the Madras Institute of Development Studies; Josh Felman, a principal at JH Consulting; and Arvind Subramanian, a Senior Fellow at PIIE and India’s former Chief Economic Adviser.
Their core finding: India’s GDP growth during the boom years of 2005 to 2011 was likely underestimated by about 1 to 1.5 percentage points on average, and subsequent growth between 2012 and 2023 was overestimated by about 1.5 to 2 percentage points. The authors estimate that from 2011 to 2023, the economy actually grew at 4 to 4.5 percent on average, not the 6 percent officially reported. In plain terms, the story of India as the world’s fastest-growing major economy may have been significantly embellished. Not through deliberate fraud, but through a methodological blind spot so large that hundreds of millions of informal workers were rendered statistically invisible.

The Machinery of Miscount
The paper identifies two specific methodological failures, both structural and both long-standing.
First, India’s Central Statistical Office (CSO) used formal sector data as a proxy for the vast informal sector, which accounts for roughly 44 percent of Gross Value Added. This assumption held because, from 2010 to 2015, formal and informal sector sales growth were essentially identical. Using the former as a proxy for the latter was therefore valid during that period. Then came three body blows: demonetisation in 2016, the rollout of GST, and the COVID-19 pandemic. Each of these shocks hit the informal economy disproportionately hard.
The paper provides direct evidence for this divergence. Official survey data show that after the shocks, annual nominal growth averaged 10.0 percent in the formal sector and just 6.8 percent in the informal sector, a difference of 3.3 percentage points annually. Informal GVA grew at 5.4 percent according to NSS survey data, against the National Income Accounts figure of 9 percent, a direct and measurable gap. The informal sector was visibly falling behind; the GDP methodology was not capturing it.

A complicating factor: the MCA-21 corporate database, which the 2015 methodology leaned on heavily, itself had serious data quality problems. The 74th NSS Round (July 2016 to June 2017) found that 16.4 percent of companies registered with MCA were nontraceable or closed, and 21.4 percent had been misclassified on the ground. In other words, the very foundation of the formal-sector proxy was partly built on ghost firms.
Second, the paper flags a fundamental problem with price deflators. The 2015 methodology deflated large portions of GDP using the Wholesale Price Index (WPI), including several major service categories, despite the WPI being an input-price measure heavily weighted toward commodities, particularly oil. Between 2011 and September 2025, WPI growth averaged 2.2 percentage points lower than CPI growth annually. With heavy reliance on the WPI, the GDP deflator averaged 1.4 percentage points lower than the CPI over the same period. A lower deflator mechanically produces a higher “real” growth number, regardless of what is actually happening in the economy. The paper presents a clear illustrative calculation: deflating nominal value added using an input-price index instead of an output-price index inflates real growth from 0.5 percent to 2.4 percent in a scenario where actual production did not change at all.
The Vanishing Rs 80 Lakh Crore
The most visceral evidence did not come from PIIE. It came from India’s own government. On February 27, 2026, MoSPI released a new GDP series with base year 2022-23, replacing the old 2011-12 series.
The revision carried a remarkable admission: private consumption expenditure, by far the largest component of India’s GDP, had been overestimated by approximately 9.6 to 11.5 percent in every single year from 2022-23 to 2025-26. The specific figures are stark. In 2025-26, the new series puts private consumption at Rs 195.8 lakh crore in nominal terms, against the old series’ estimate of Rs 219.6 lakh crore, a gap of Rs 23.8 lakh crore in a single year. In 2024-25, private consumption under the new series was Rs 179.7 lakh crore, against the old series’ estimate of Rs 203 lakh crore, a difference of 11.5 percent.
Cumulatively, across just four financial years from 2022-23 to 2025-26, Rs 80.7 lakh crore of private consumption, roughly 10.5 percent of the cumulative total, has been revised out of the official record. It was never really there. It existed in spreadsheets and press releases, not in wallets or markets.
What the Ground Always Knew
The tragedy of this statistical failure is not merely academic. Ground-level data had been registering distress for years, systematically dismissed by analysts incentivised toward optimism. The verified indicators are as follows:

– Domestic two-wheeler sales peaked in 2018-19 and have not crossed that figure since, including the forecast for 2025-26[2]
– Domestic small car sales also peaked in 2018-19 and remain below that level despite the GST cut in September 2025
– Non-suburban traffic on Indian Railways peaked in 2012-13 at 3.94 billion passengers and is expected to be only 3.32 billion in 2025-26
– Mobile phone teledensity** peaked in 2017-18
– Net sales of approximately 4,700 listed firms have been growing at less than 10 percent for close to three years, though growth improved through 2025-26
– Real credit growth fell from 15.6 percent per year in 2005-11 to 5.6 percent per year in 2012-24
– Real exports growth fell from 13.9 percent per year to 5.4 percent per year
– IIP growth collapsed from 16.1 percent to 2.9 percent per year
– Direct tax revenue growth fell from 13.0 percent to 7.0 percent per year
In the demonetisation year of 2016, real corporate sales grew at just 1.4 percent while official real GVA showed 8.0 percent growth. In 2019, real sales actually fell 4.5 percent while official GVA rose 3.0 percent. In 2024, real sales rose 2.2 percent against official GVA growth of 6.4 percent.These are not rounding errors. They are a consistent, multi-year breakdown in the relationship between what the economy was doing and what the official numbers reported.
Furthermore, the paper demonstrates using cross-country data that macro indicators reliably predict GDP growth across most nations, even in the 2012-24 period. But India became a systematic outlier, with growth consistently higher than what the indicators predicted, precisely after the 2015 methodology was introduced.
The Government’s Acknowledgement and Its Contradictions
The February 2026 MoSPI revision incorporated GSTN data, MCA-21 filings, and e-Vahan vehicle registration data, precisely the richer administrative sources that critics had long demanded. The paper itself acknowledged the revision as the result of “commendable consultations.” The government, through this act, acknowledged that the old methodology was insufficient.

Yet a critical gap remains. The new series currently covers only four financial years, from 2022-23 to 2025-26. The back series, covering the years before 2022-23, has not yet been released. If the downward revision in consumption visible from 2022 onwards is extended backward, which the paper’s logic requires, the scale of the correction could be substantial. As analyst Vivek Kaul notes, if earlier years are also revised downward, “the recent growth would look less like a boom and more like a gradual climb back to earlier levels.”
The GST revenue argument also requires scrutiny. Much of the post-2017 tax revenue growth reflects formalization, businesses previously operating informally entering the tax net, rather than new economic activity. A trader who was always selling goods but now files GST returns appears as new output in formal statistics, even if his actual business volume has stagnated or declined.
The Critical Questions This Paper Cannot Answer
Intellectual honesty demands that the paper’s limitations receive equal weight.
The paper tests its core claim using six macro indicators: exports, bank credit, IIP, electricity consumption, direct tax revenues, and corporate sales. The authors acknowledge directly that India’s economy has changed structurally, noting that “at one time, production of electric fans and air coolers was once a reasonable indicator of growth. But that age is long gone.” They address the concern that bank credit may undercount non-bank financing by testing against BIS total credit data and find essentially the same results. They also check IIP against firm-level CMIE manufacturing sales data and find them broadly aligned. These robustness checks strengthen the paper, but cannot fully account for the unmeasured role of digital services, software exports, and platform economy activity, sectors that are genuinely difficult to capture in any of the six indicators used.
The paper was presented at Cornell University, Harvard University, IGIDR, PIIE, and the International Monetary Fund before publication. Notably, the IMF’s assessment of India’s GDP methodology in June 2025 reportedly awarded it only a C grade, meaning the world’s premier international economic institution had itself flagged methodological concerns. This significantly weakens the standard counter-argument that “international institutions accepted India’s numbers.”
This remains, however, a working paper and not a final peer-reviewed study. Arvind Subramanian raised similar concerns in a 2019 Harvard CID paper; that work was vigorously contested. The current paper is more granular, draws on newer survey data, and benefits from the February 2026 revision as partial validation. But the full cycle of academic scrutiny has only begun.
The Political Economy of Numbers
There is a dimension to this debate that goes beyond methodology. GDP growth figures are political instruments. A government claiming 7 percent growth attracts foreign investment, wins electoral narratives, and deflects criticism of unemployment or consumption distress. In this environment, the incentive structure around statistical agencies, even those staffed with honest professionals, tilts quietly toward optimistic estimates.

The paper itself does not allege deliberate manipulation. It traces the problem to two technical failures in the January 2015 methodology. But as two former officials from India’s statistical agency noted in June 2025, well before the PIIE paper appeared: something does not add up. The admission came from within the system itself, quietly and without fanfare.
The February 2026 revision is commendable. But it took years of pressure from researchers, statisticians, journalists, and independent economists before the numbers began to move toward what ordinary Indians had experienced: an economy that looked better on paper than it did in their pockets. Politicians understood this before the data did, which is why cash distribution programmes proliferated across states in recent years, a political acknowledgement through fiscal action of a consumption economy under severe stress.
What Comes Next
The real test arrives when MoSPI releases the back-series data. If the downward revision in private consumption that characterises 2022-26 is extended backward to 2012-23, India’s celebrated growth decade will require significant recalibration.
That would not be a national embarrassment. It would be a statistical correction of the kind that serious, self-confident democracies make. The embarrassment lies not in finding errors, but in the years spent resisting scrutiny.
The numbers finally caught up with what two-wheeler sales, railway traffic, corporate sales data, and the quiet hardship of India’s informal economy had been signalling all along. Whether policymakers will govern by the corrected reality, or continue to comfort themselves with the old, flattering fiction, is the question that matters now.
All data and findings cited directly from: PIIE Working Paper 26-3 (Anand, Felman, Subramanian, March 2026); Vivek Kaul in Newslaundry, March 14, 2026; MoSPI GDP press release, February 27, 2026; IGIDR Working Paper 2019.
Read the PIIE Working Paper 26-3 here









This piece raises important questions about how economic growth is measured and perceived in India. It thoughtfully highlights the gap between statistical prosperity and ground realities.